Trap Bias in Greyhound Racing: How Starting Position Affects Results
Does the Starting Box Matter?
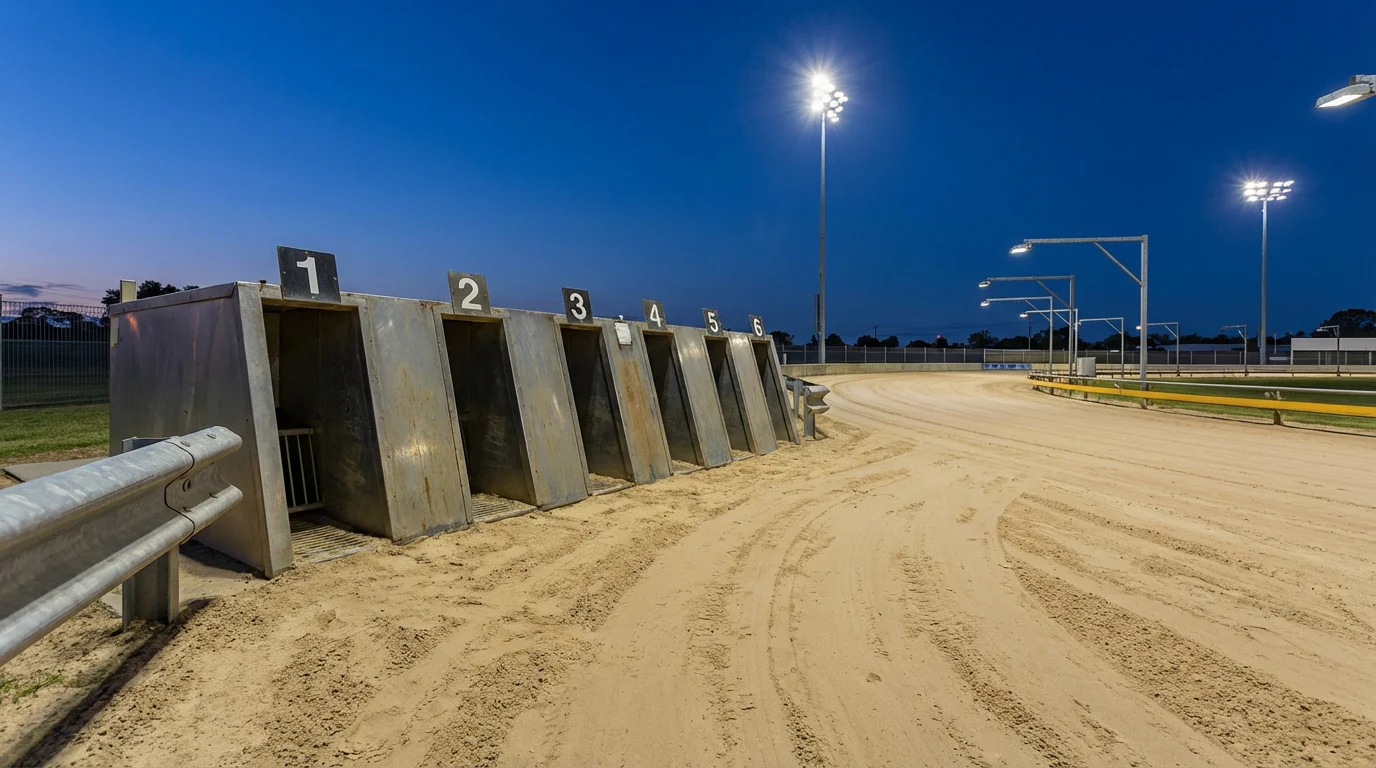
Six traps, six colours, six dogs — and the assumption that each has an equal chance. Except they do not. In greyhound racing, the starting position is not a neutral variable. Across thousands of races at every UK track, certain traps produce more winners than probability alone would predict, and others produce fewer. That persistent imbalance is what the betting world calls trap bias, and understanding it is one of the foundational skills of greyhound race analysis.
Trap bias is not a conspiracy or a flaw in the sport. It is a straightforward consequence of physics and track geometry. A greyhound track is an oval. The bends are tighter on the inside than the outside. Dogs drawn in lower-numbered traps — closer to the inside rail — have a shorter path to the first bend and a structural advantage in establishing early racing position. Dogs drawn outside cover more ground to reach the same point. Over a large enough sample, this difference shows up in the results.
The size of the bias varies by track, by distance, and by the specific geometry of each circuit. At some venues, the inside advantage is dramatic. At others, it is barely detectable. Knowing which tracks exhibit strong trap bias — and which do not — allows you to weight the draw correctly when analysing a race. It does not replace form analysis, but it adds a quantitative layer that sharpens your selections.
Find more race analysis at crayforddogsresults.
What Trap Bias Data Shows Across UK Tracks
If every trap had an equal chance of winning a six-dog race, each would win approximately 16.7% of the time. In practice, the percentages are never perfectly balanced. The question is whether the deviations are large enough to matter, and at which tracks they are most pronounced.
At Romford, with its 350-metre circumference and 67-metre run to the first bend, the inside traps — particularly trap one and trap two — win at a rate meaningfully above 16.7% over the standard 400-metre distance. This is one of the strongest trap biases on the UK circuit, and it is a direct function of the track’s compact dimensions. The short run-in means inside dogs reach the first bend before outside dogs have fully accelerated, and the tight bends amplify the rail advantage through the rest of the race.
At Hove, the picture is different. The 455-metre circumference and 105-metre run-in on four-bend races give outside dogs more time and space to establish position. The trap statistics at Hove show a much flatter distribution, with trap four holding a marginal edge but no single trap dominating. The wider, more open layout reduces the structural advantage of the inside draw.
Monmore Green sits between these extremes. Its 419-metre circumference and 103-metre run-in produce trap data that leans toward the inside traps but with less intensity than Romford. The bias is present but moderate — enough to factor into analysis, not enough to build a strategy around.
Sheffield, Nottingham, Perry Barr, and the other active UK tracks each have their own trap profiles, shaped by their individual dimensions and geometries. The key point is that trap bias is track-specific. A blanket rule like “always back trap one” would be profitable at some venues and ruinous at others. The only responsible approach is to study the data for each track you bet on and adjust accordingly.
Most greyhound data services and results platforms publish trap statistics, either as raw win percentages or as breakdowns by distance. Aggregating the last six to twelve months of data gives you a reliable picture of the current bias, updated enough to reflect any changes in track surface or layout that might have shifted the numbers.
One nuance worth noting: trap bias data is distorted by the grading system. Because racing managers allocate traps based on running style — typically placing front-runners in inside traps and dogs that prefer to run wide in outside traps — the win statistics partly reflect deliberate allocation rather than pure geometric advantage. A fast dog drawn in trap one was often given that trap because the racing manager knew it would break well and lead from the inside. Disentangling the effect of the trap itself from the effect of the dogs allocated to it is a challenge that simple win-percentage data does not resolve. The bias is real, but its magnitude may be slightly overstated by raw statistics.
The most robust approach is to combine the statistical data with your own observations from watching races at the track. If you notice that outside-drawn dogs consistently struggle to get into the first bend cleanly — regardless of their form — the track’s geometry is doing the work. If outside-drawn dogs occasionally win comfortably when they have superior early pace, the bias is present but not absolute. Both observations are useful for calibrating how much weight to give the draw in your analysis.
Factors Behind Trap Bias: Bends, Distance, and Surface
The inside-rail advantage is the most commonly cited factor, but trap bias is actually the product of several interacting variables. Understanding each helps you predict not just whether bias exists at a given track, but how it might change under different conditions.
The run to the first bend is the single most important factor. A short run-in compresses the field before dogs have time to find their stride, funnelling them into the first turn while inside dogs are already on the rail and outside dogs are still accelerating. Tracks with run-ins below 80 metres — Romford being the prime example — tend to show the strongest inside bias. Tracks with run-ins above 100 metres give the field more time to sort itself out, reducing the first-bend bottleneck that generates the bias.
Bend radius matters too. Tighter bends force dogs to decelerate more sharply, and dogs running wide through a tight bend lose more ground than those on the rail. At tracks with generous, sweeping bends — Hove, for instance — the speed differential between inside and outside running lines is smaller, and the penalty for racing wide is less severe.
Distance interacts with trap bias in a predictable way. The shorter the race, the stronger the bias. In a 225-metre sprint at Romford, there are only two bends and perhaps thirteen seconds of running. The first bend decides most of the race, and the inside traps get there first. Over 575 metres with six bends, the race develops over a longer period, dogs have more time to recover from poor early positions, and the cumulative effect of the initial draw diminishes. Trap bias at any given track will be strongest over the shortest distance and weakest over the longest.
Surface condition adds a secondary variable. A wet, heavy track tends to slow all dogs but may particularly disadvantage those running wider, because the wider running line often coincides with the parts of the track that drain less efficiently. A fast, dry surface narrows the performance gap between inside and outside. These effects are modest compared to the structural factors of track geometry, but they are real enough to matter on nights when conditions are notably different from the average.
Finally, the hare type and position can influence running lines. Tracks using an outside hare may encourage dogs to run wider as they chase the lure, which can slightly offset the inside-rail advantage. Tracks with an inside hare push the field toward the rail, reinforcing the bias. Most UK tracks now use the outside Swaffham hare, but the principle applies regardless of the specific system.
Using Trap Stats in Your Betting
Trap bias data is most useful as a tiebreaker rather than a primary selection tool. If two dogs in a race have similar recent form, similar running styles, and similar credentials for the distance, the one drawn in a statistically favoured trap has a structural edge that tips the balance. That is a legitimate use of the data. Backing a dog purely because it is in trap one, regardless of its form, is not.
The practical application involves three steps. First, know the trap profile of every track you bet at. This means spending ten minutes checking the win-percentage data for each trap at each distance — a one-time task that you update periodically. Second, integrate the bias into your race assessment as one factor among several. A strong trap draw supports a selection; it does not create one. Third, adjust your confidence level when the draw works against a selection. If you fancy a dog that is drawn in a weak trap, you might reduce your stake or look for better value elsewhere on the card rather than forcing the bet.
Trap bias also informs how you assess market prices. A dog drawn in trap one at a track with strong inside bias may be shorter in the market partly because of the draw, and the bookmaker’s price already accounts for the advantage. In that case, the bias is priced in and there is no value in simply backing the inside draw. Conversely, a dog drawn in trap five at the same track might drift to a bigger price partly because of the draw, and if your form analysis suggests it has the early pace to overcome the disadvantage, the market may be overreacting to the trap — creating genuine value.
The most sophisticated approach treats trap bias as one input in a multi-factor model that includes form, distance suitability, running style, trainer data, and surface conditions. None of these factors operate in isolation, and the punter who weighs them collectively will outperform the one who fixates on any single variable.
Bias Is a Trend, Not a Guarantee
Every statistical trend in greyhound racing exists as a probability, not a certainty. Trap one at Romford might win 22% of 400-metre races over a twelve-month sample. That means it loses 78% of the time. No amount of trap bias data can tell you which specific race will produce the exception, and the punter who bets every race on the basis of trap advantage alone will experience long losing runs that no statistical edge can absorb unless the staking is appropriately cautious.
What trap bias does provide is a baseline expectation against which you can calibrate your analysis. If you know that a particular trap at a particular track wins at a rate above random, you can give that information appropriate weight when it aligns with other positive factors. When it conflicts with those factors — when a dog with poor form draws a strong trap — the bias alone is unlikely to rescue the selection.
The data is also subject to change. Tracks are resurfaced, hare systems are adjusted, and the run to the first bend can alter slightly after maintenance work. A trap profile that held for two years might shift after a summer resurfacing. Keeping your data current — checking quarterly at minimum — prevents you from relying on an outdated picture of how a track rides.
Also read our greyhound trap colours.
Used correctly, trap bias is a quiet, steady contributor to better selections. It will never produce a headline-grabbing betting angle or a single transformative win. But it will, over hundreds of bets, tilt your results slightly toward the positive by ensuring you are never ignoring information that is freely available and demonstrably relevant. In greyhound betting, that kind of incremental advantage is exactly how long-term results are built.